 One of the challenges of real-world engineering problems is the need to predict the behavior of a system which may be complex, dynamic, nonlinear and subject to uncertainty as to loading and response. Foundation problems are a good example of this. The behavior of a foundation is complex; it is a soil structure interaction problem in which the behavior of the ground and the configuration of the superstructure will influence the results. Foundation behavior may be dynamic, in the sense that the response can be sensitive to initial conditions and the loading history. Loads can also be applied dynamically. However, the complex and dynamic nature of foundation problems is driven by the nonlinear behavior of structures and soil-structure interaction.
In actuality, nonlinearity is not the whole problem; instead, it is nonlinearity and uncertainty. When a parameter in a model is subject to uncertainty, its value is best represented by a probability distribution characterized by an average and variance. Since the average is the statistically “expected value”, it is often convenient to work with the average to turn a probabilistic problem into a deterministic one. For a linear model, this works; the output assumes a similar distribution as the input such that the average output is equal to the result of the model for the average value of the input. However, for a nonlinear model, the function of the average input may have no relation to the average of the output for the input distribution.
Consider an example: Previously, I reviewed the geotechnical report and borings for a public building in Northwest Washington, DC to show that the bearing capacity used for design could be approximately doubled compared to the common practice of using presumptive code values by analyzing the subsurface data and using bearing capacity equations. In that example, I computed the capacity to be about 3,700 pounds-per-square-foot (psf) based on strength, as determined by the Terzaghi equation using Vesic’s bearing capacity factors.
In my example, I classified the soil samples by likely geologic stratum and averaged the field blowcounts from standard penetration tests for each stratum. The average blowcounts were used to compute an internal friction angle per Peck et al. From this the Vesic bearing capacity factors were calculated for use in Terzaghi equation. The friction angle correlation and bearing capacity factors are nonlinear models.
As an experiment, I repeated my analysis, but calculated the bearing capacity for each field blow count individually. This may not make physical sense, considering that bearing capacity is not a material property, but really a simple model of a foundation system’s response to load. However, this approach provides a means to account for the statistical distribution of the blowcounts in the bearing capacity analysis.
Generally, averaging the results of the bearing capacity equations for each field blowcount produced a higher value than computing the bearing capacity for the average blow count of the stratum. The allowable bearing capacity increased from about 3700 psf to about 5200 psf for the sand stratum and from about 4200 psf to about 4600 psf for the silt stratum. Since both materials could be encountered at footing elevation, the lower value would likely be selected for design. Note, however, that while the bearing capacity for silt controls overs that of the sand, the average blow count is higher (19.5 blows/foot) than that of the sand (16.5 blows/foot).
So what has happened here? When a mathematical function acts on a data set with a given distribution, the resulting distribution is typically shifted and either stretched or compressed. When the function is linear, as is the case for the allowable bearing capacity as a function of ultimate bearing capacity, the average and standard deviation are both scaled by the same factor.
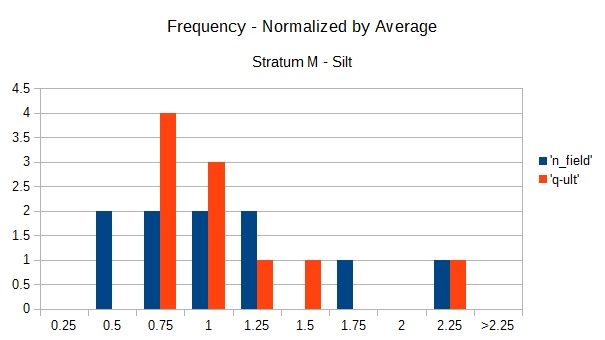
For a nonlinear function, the behavior is less intuitive. To illustrate this, I have plotted distributions of the field blowcounts and resulting ultimate bearing capacity values for the sand and silt below. Both data sets are scaled by the average values so they can be compared. For the most part, the distribution of the bearing capacities is clustered closer to the average than the field blowcounts on which they are based. The shift of bearing capacities for the lower blowcounts is particularly evident, effectively reshaping the distribution.
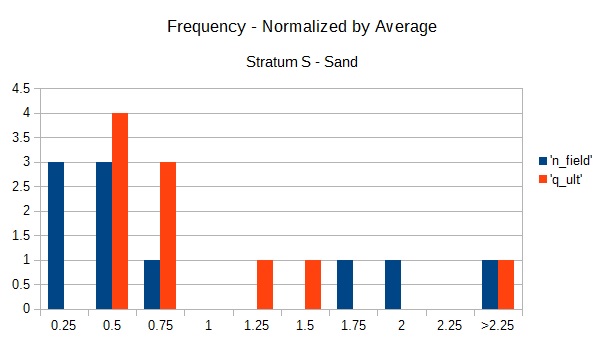
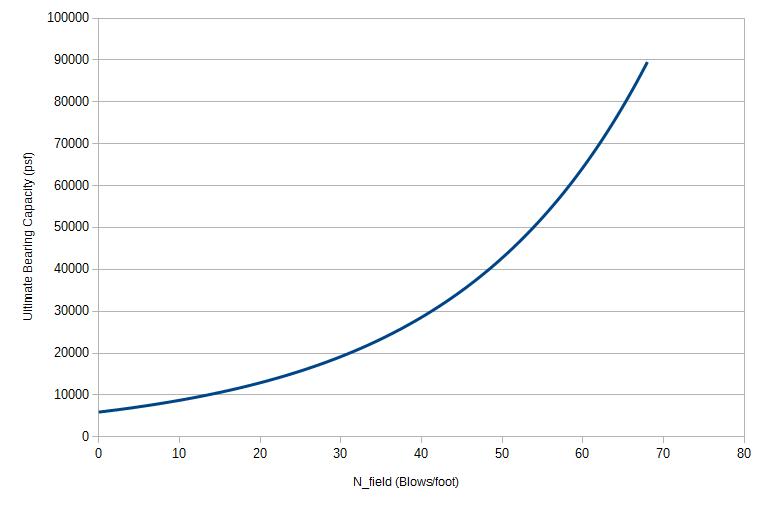
Why is this? Take a look at the plot of ultimate bearing capacity versus field blowcounts. For small blow counts, the slope of the bearing capacity curve is relatively flat and is never much less than 6000 psf. The effect of the lower blowcounts cannot, therefore, weigh down the average too much. However, the slope of the curve increases greatly as the N-value increases. As a result, the effect of a high N-value is amplified. The resulting distribution of the bearing capacities is narrow near the average and then skewed towards higher values.
The blowcounts for the sand are distributed between 4 and 60 but clustered on the low end. The blowcounts for the silt are more clustered near the average, ranging from 8 to 42. Since the bearing capacity equations are less sensitive to the blowcounts on the low end than on the high end the distribution of the bearing capacity for sand shows more of a shift and skew. The skew shifts the average value higher than that of the silt.
The nonlinear nature of the bearing capacity analysis results in the output being distributed differently from the input. The effect of this operation varies with the input distribution in a way that is not necessarily intuitive. Despite the data showing a looser soil, the calculated bearing capacity for the sand is higher than the denser and more homogenous silt. This is an example of the difficulty in using nonlinear models when the inputs are subject to uncertainty.
In reality, even in this simple example, there are more sources of uncertainty than what I have accounted for here. For example, soil unit weight is a parameter in the bearing capacity analysis and was kept constant in this analysis. Unit weight is also randomly distributed and difficult to measure in the field. In addition, while rarely considered in practice, there is some error associated with any model and it can compound as more models are layered in an analysis.
Now imagine that I tried to use an advanced soil model in a finite element package to solve the same problem starting with the same limited data. Set aside the fact that finite element methods are not usually well suited to determining the capacity of a system. In addition to the friction angle and unit weight, I would have a needed to several additional parameters to model the nonlinear stress-strain behavior. Even when these parameters are determined by testing, there is still uncertainty and epistemic error associated with the soil models. However, in this case, the parameters would have to be correlated to blowcounts, if not assumed entirely, adding significantly to the uncertainty and potential error.
The point is not to suggest that nonlinear models should not be used. Instead, they must be used carefully. The method of analysis chosen for any project should be compatible with the quality of the inputs and the demands for the outputs. If relatively little is known about the subsurface conditions and a detailed analysis will not result in a substantially more economical design (think residential or light, one-story commercial), then prescriptive code values for bearing capacity and the like are probably appropriate. If foundation construction requires deep excavation in challenging soil, placing several adjacent properties at risk, then nonlinear finite element analysis or another soil-structure interaction approach may be appropriate. But in that case, the subsurface exploration and laboratory testing must be sufficient to provide representative soil parameters. For the in-between cases, a variety of methods are available that balance simplicity and sophistication. Experience and judgment are required to be able to weigh the trade-offs associated with each method so as to select the right choice for the project.
The information and statements in this document are for information purposes only and do not comprise the professional advice of the author or create a professional relationship between reader and author.
See also: Foundation / Geostructural Engineering